Hi! I'm Artesia Kaboré
Financial Data Analyst
Excel | Tableau | SQL | AI Tools
Parker, Colorado USA

Projects
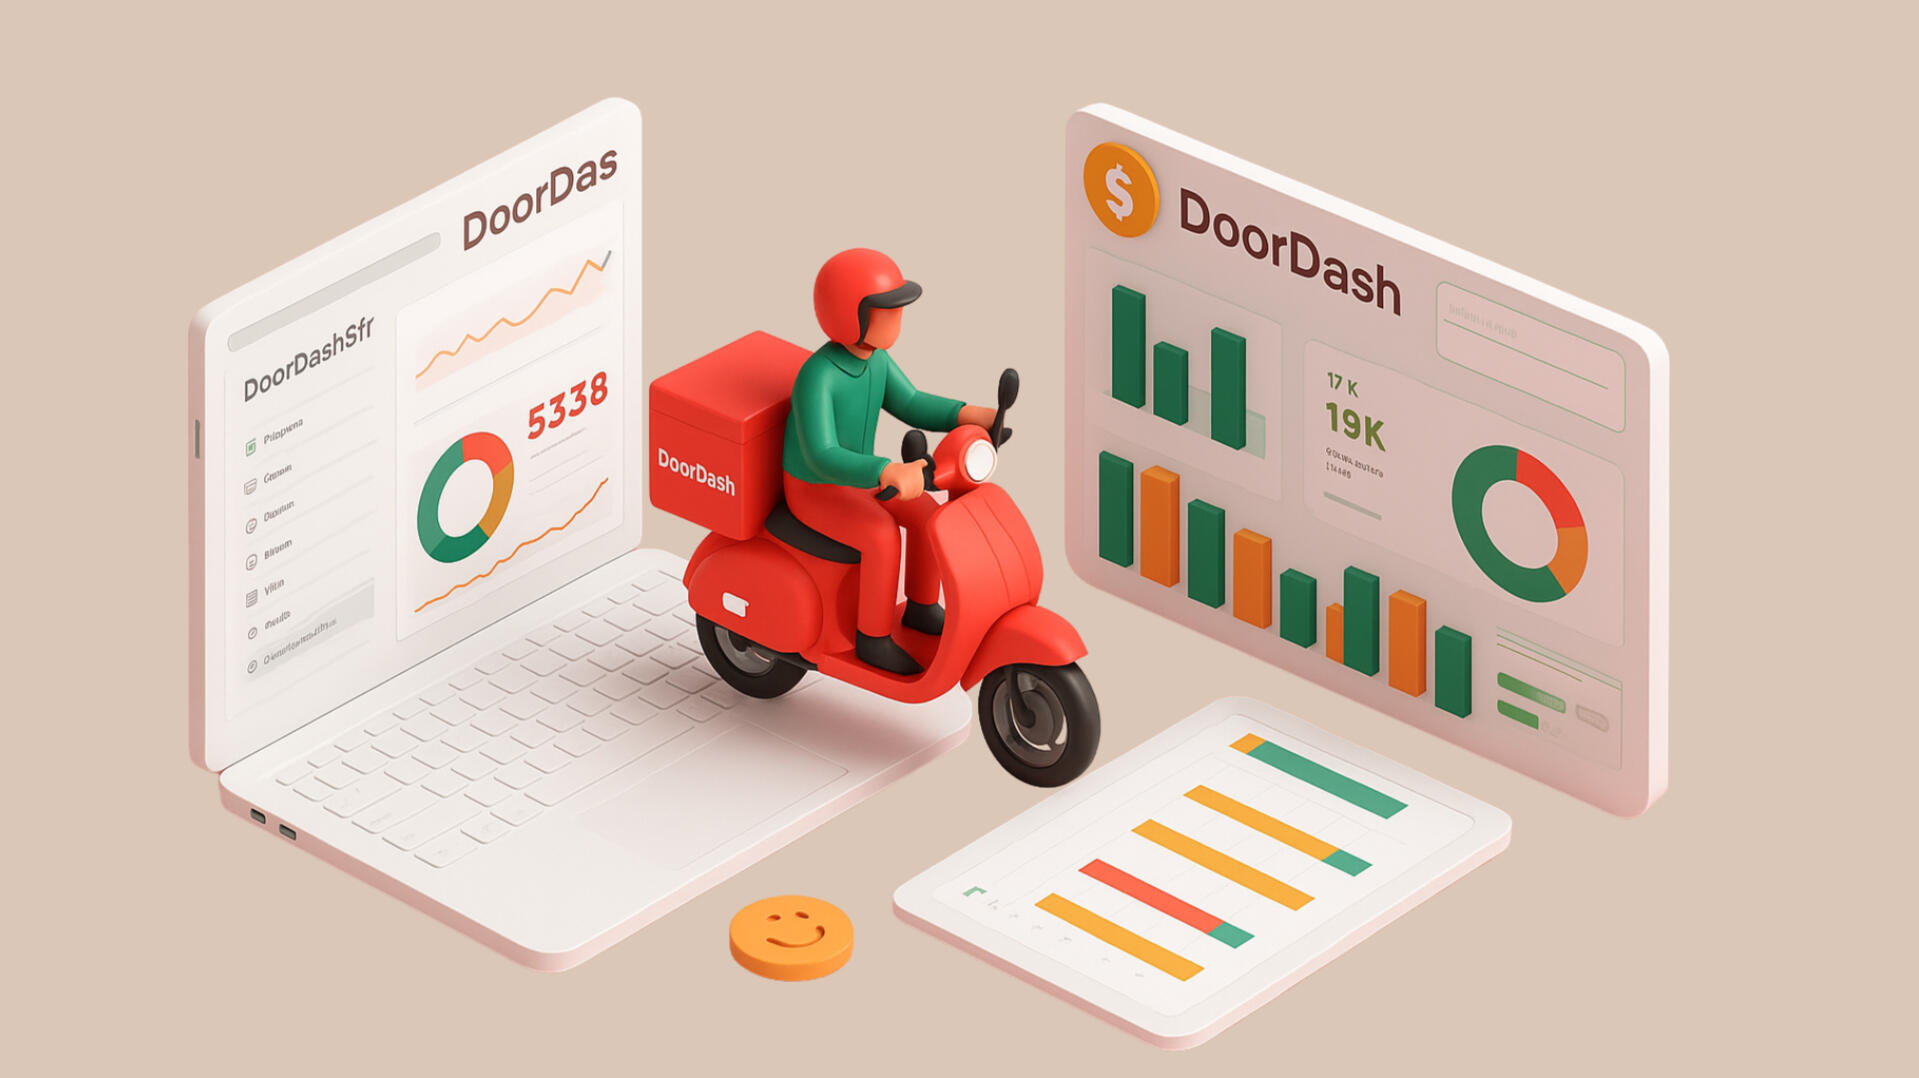
DoorDash Project
Excel | Exploratory Data Analysis◾ Real world-marketing campaign data
◾ Used only Excel for analysis and data visualization
◾ Utilized VLOOKUPS, pivot tables, scatter plots, and bar charts
◾ Wrote a comprehensive article presented on LinkedIn

Education Project
Tableau | Data Visualization◾ Created dashboard evaluating over 1,800 different schools' performance across 100's of features
◾ Used scatter plots, KPI's, and bar charts to show performance differences
◾ Presented dashboard on LinkedIn via recorded Loom video

Finance Project
SQL | Exploratory Data Analysis
◾ Data-mined 1.48M real World Bank transactions to find financial outliers, patterns, & trends
◾ Used SQL clauses, functions, and operators such as SELECT, WHERE, FROM, GROUP BY, ORDER BY, AVG, MIN/MAX, SUM, AND, OR, NOT, etc
◾ Created written report highlighting findings

Healthcare Project
SQL | Exploratory Data Analysis◾Analyzed what affects hospital stay length in MySQL
◾Created a histogram using SQL
◾Real data from 101,766 hospital patients
.
About me
Hello from Colorado! I'm a stay at home mom who rediscovered a passion for evidence and processes, which led me to pivot into data analytics. My bachelors degree in Mathematics and current Financial Analyst role has driven my expertise in analyzing data to guide business decisions.